

The COVID-19 pandemic has made the world painfully aware of the importance of contact tracing. Knowing who is infected, as well as when and where that person was infected, is required in order to be able to contain an outbreak of a virus infection. The lack of this knowledge has forced most of the countries in the world to implement restrictions and lockdowns, which have led to severe social disruptions and a global economic recession.
The development of rapid detection test devices has allowed for contact tracing in the areas of society that are critical and cannot shut down, such as healthcare and food supply. Access to inexpensive tests has also allowed for people to self-diagnose and then self-isolate, if infected. This has also helped in slowing down the spreading of the virus. South Korea and Germany have successfully used testing to slow down the pandemic on a broader scale, in all areas of society (Ref. 1).
One possible rapid detection test for COVID-19 is based on lateral flow assay (LFA), also called lateral flow immunoassay (LFIA) or immunochromatographic tests. The standard pregnancy test that can be bought at supermarkets is probably the most familiar application of LFA. LFA offers an inexpensive, relatively reliable, robust, and easy-to-use test for many diseases and conditions (Ref. 2).
In this two-part blog series, we use the COMSOL Multiphysics® software to understand the function of LFA devices and the challenges that an engineer may encounter when designing these devices.
The Mechanisms Behind LFA Rapid Detection Tests
If we look at the mechanisms behind these rapid detection tests, we can see that they are quite advanced, yet very robust, microlaboratories.

Schematic drawing of a rapid detection test device. Here, the thickness of the membranes and pads is exaggerated by a factor of 5 in order to show the structure. The assembly of the pads and the membrane can be referred to as a test strip.
The test consists of the following parts (shown in the figure above):
- Sample pad
- Conjugation pad
- Membrane
- Absorption pad, also called a wick pad
The assembly of the different components (pads and membrane) is often referred to as the test strip. The test strip is protected by a plastic housing (Ref. 3).
The pads and the membrane are porous. The pore walls should be wetted by the sample liquid. The sample may be prepared before it is applied on the test strip, or it may be prepared in the sample pad. The sample is obtained by mixing blood or saliva with a buffer. The buffer may contain reference antibodies and other chemicals, such as solvents that ensure that the sample wets the pore walls of the different components.
The sample pad receives the droplets of the sample and acts as a distributor of the flow, and as a filter. Very large proteins and blood cells are trapped in the sample pad’s porous structure. In addition, the porous structure makes sure that the sample liquid is distributed evenly along the width of the pad. Once the sample has filled the sample pad, it continues to flow in the direction of the conjugation pad. The driving force for the flow is the capillary force, which is caused by the interaction of the liquid with the pore walls.
In the conjugation pad, the filtered sample dissolves reagents, so-called conjugation labels, that have been applied to the conjugation pad during manufacture. The labels are usually antigens attached to the surface of, for example, gold nanoparticles. An antigen may be a protein that triggers antibodies in the immune system. These labels may attach to the antibodies in the sample, forming a complex of antibodies and conjugation labels. The complexes are dissolved in the sample liquid. They may consist of labels attached to antibodies from the patient and labels attached to reference antibodies that are mixed in the sample during preparation. Once the sample has filled the pores in the conjugation pad, it continues to the membrane, again driven by the capillary force.
The sample continues its flow through the membrane. The membrane is usually made of porous nitrocellulose, but other materials may be used. Different proteins and chemical species may also interact with the pore walls of the porous membrane. Some species may adsorb and desorb on the pore walls. This interaction tends to separate different species along the flow path, depending on the size of the species molecules and on their affinity to interact with the pore surface. This action is what is referred to in the term “immunochromatography”.

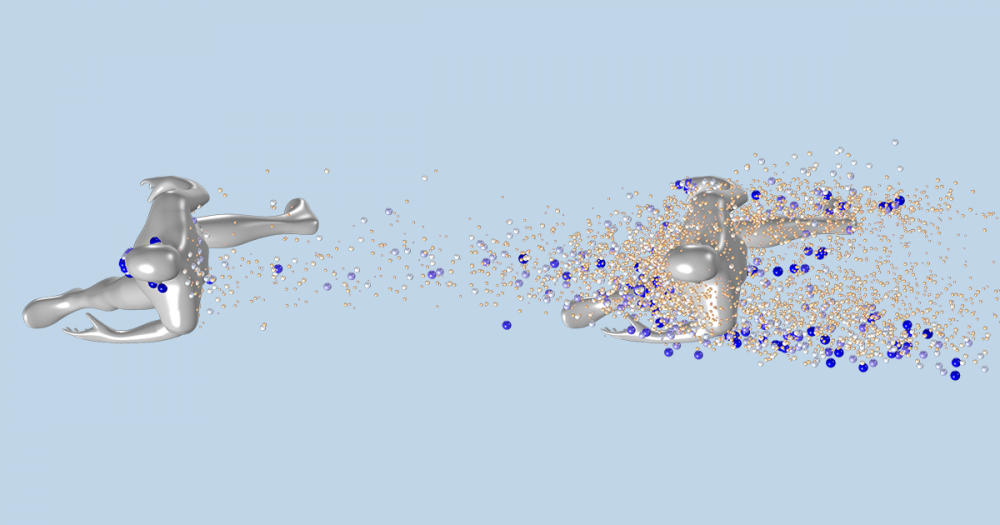
In this figure, the sample liquid has just reached the membrane. The magnification shows a rectangle with about 1 µm in side length. The average pore diameter is about 0.5 µm. As a comparison, the membrane is 125 µm thick (Ref. 3). The liquid sample is represented by light blue. The membrane consists of a solid network, like a skeleton, with the pores making up 70% of the membrane volume. The sample liquid wets the walls of the skeleton structure, the pore walls, and is driven in the direction of the blue arrows by the capillary forces into the air-filled pores. Note that the thickness of the test strip in this drawing is exaggerated by a factor of 5 for clarity.
Once the sample makes contact with a test line, one of the complexes may attach to a specific surface species present in the area of that test line. Such surface species may be an antibody that is immobilized on the test line surface. Each test line can attach a specific complex. Note that the surface species is stationary in the test line area; it is neither dissolved nor transported by the sample. Once a complex attaches to the test line, the area of the test line changes color. The color then shows that a specific complex of a specific antibody has attached to the specific test line.
The last test line in the membrane is the control line. The control line should always detect the presence of the complex of the reference antibody with the conjugation chemical, since the reference antibody is always mixed into the sample. If the control line does not detect this complex, then this implies that the sample has not passed through the test strip in a correct way. The test should then be discarded.
When the sample has filled the membrane, it continues its flow to the absorption pad, which acts as a wick. The absorption pad sucks up the sample and this suction drives the sample through the test strip until the absorption pad is completely filled with the sample.
Preview of the Model
In the next blog post in this series, two models of the LFA device are presented. They reveal several of the features that are experimentally observed by scientists working with the design of these tests. Among such features is how the flow depends on the saturation of pore volume of the liquid sample. Stay tuned for the follow-up post!

Spreading of the liquid sample in the test strip. The simulation shows that the sample develops a flat velocity profile once it has reached about one third into the conjugate pad.
References
- T. Kilic, R. Weissleder, and H. Lee, “Molecular and Immunological Diagnostic Tests of COVID-19: Current Status and Challenges”, iScience, vol. 23, no. 101406, 2020, (https://www.cell.com/iscience/pdf/S2589-0042(20)30596-4.pdf).
- B.G. Andryukov, “Six decades of lateral flow immunoassay: from determining metabolic markers to diagnosing COVID-19”, AIMS Microbiology, vol. 6, no. 3, pp. 280–304, 2020, (https://pubmed.ncbi.nlm.nih.gov/33134745/).
- “Rapid Lateral Flow Test Strips, Considerations for Product Development”, Merck Millipore, 2013 EMD Millipore Corporation, Billerica, MA, USA.

Comments (0)