Elevating the Performance of Ionization Gauges with Simulation
Semiconductor manufacturing, particle physics research, and other valuable processes occur in high-vacuum or ultra-high-vacuum (HV/UHV) conditions. To help develop a better ionization gauge for measuring pressure in HV/UHV environments, instrument manufacturer INFICON of Liechtenstein used multiphysics modeling to test and refine their impressive new design.
By Alan Petrillo
June 2023
Innovation often becomes a form of competition. It can be thought of as a race among creative people, all striving toward some worthwhile goal. But even the most intense competitors must share some consensus about how they pursue success. Just as every runner in a footrace is timed by the same stopwatch, competitors in other fields rely on standardized tools that measure progress toward the finish line.
For many who strive for technological innovation, one such essential tool is the vacuum gauge. High-vacuum and ultra-high-vacuum (HV/UHV) environments are used for researching, refining, and producing many manufactured goods. But how can innovators be sure that pressure levels in their facility's vacuum chamber are truly aligned with those in other facilities? Without shared standards and reliable tools for meeting these standards, key performance metrics — for both the vacuum chambers and the products being tested — may not be comparable.
Global Competition Yields Winning Prototype
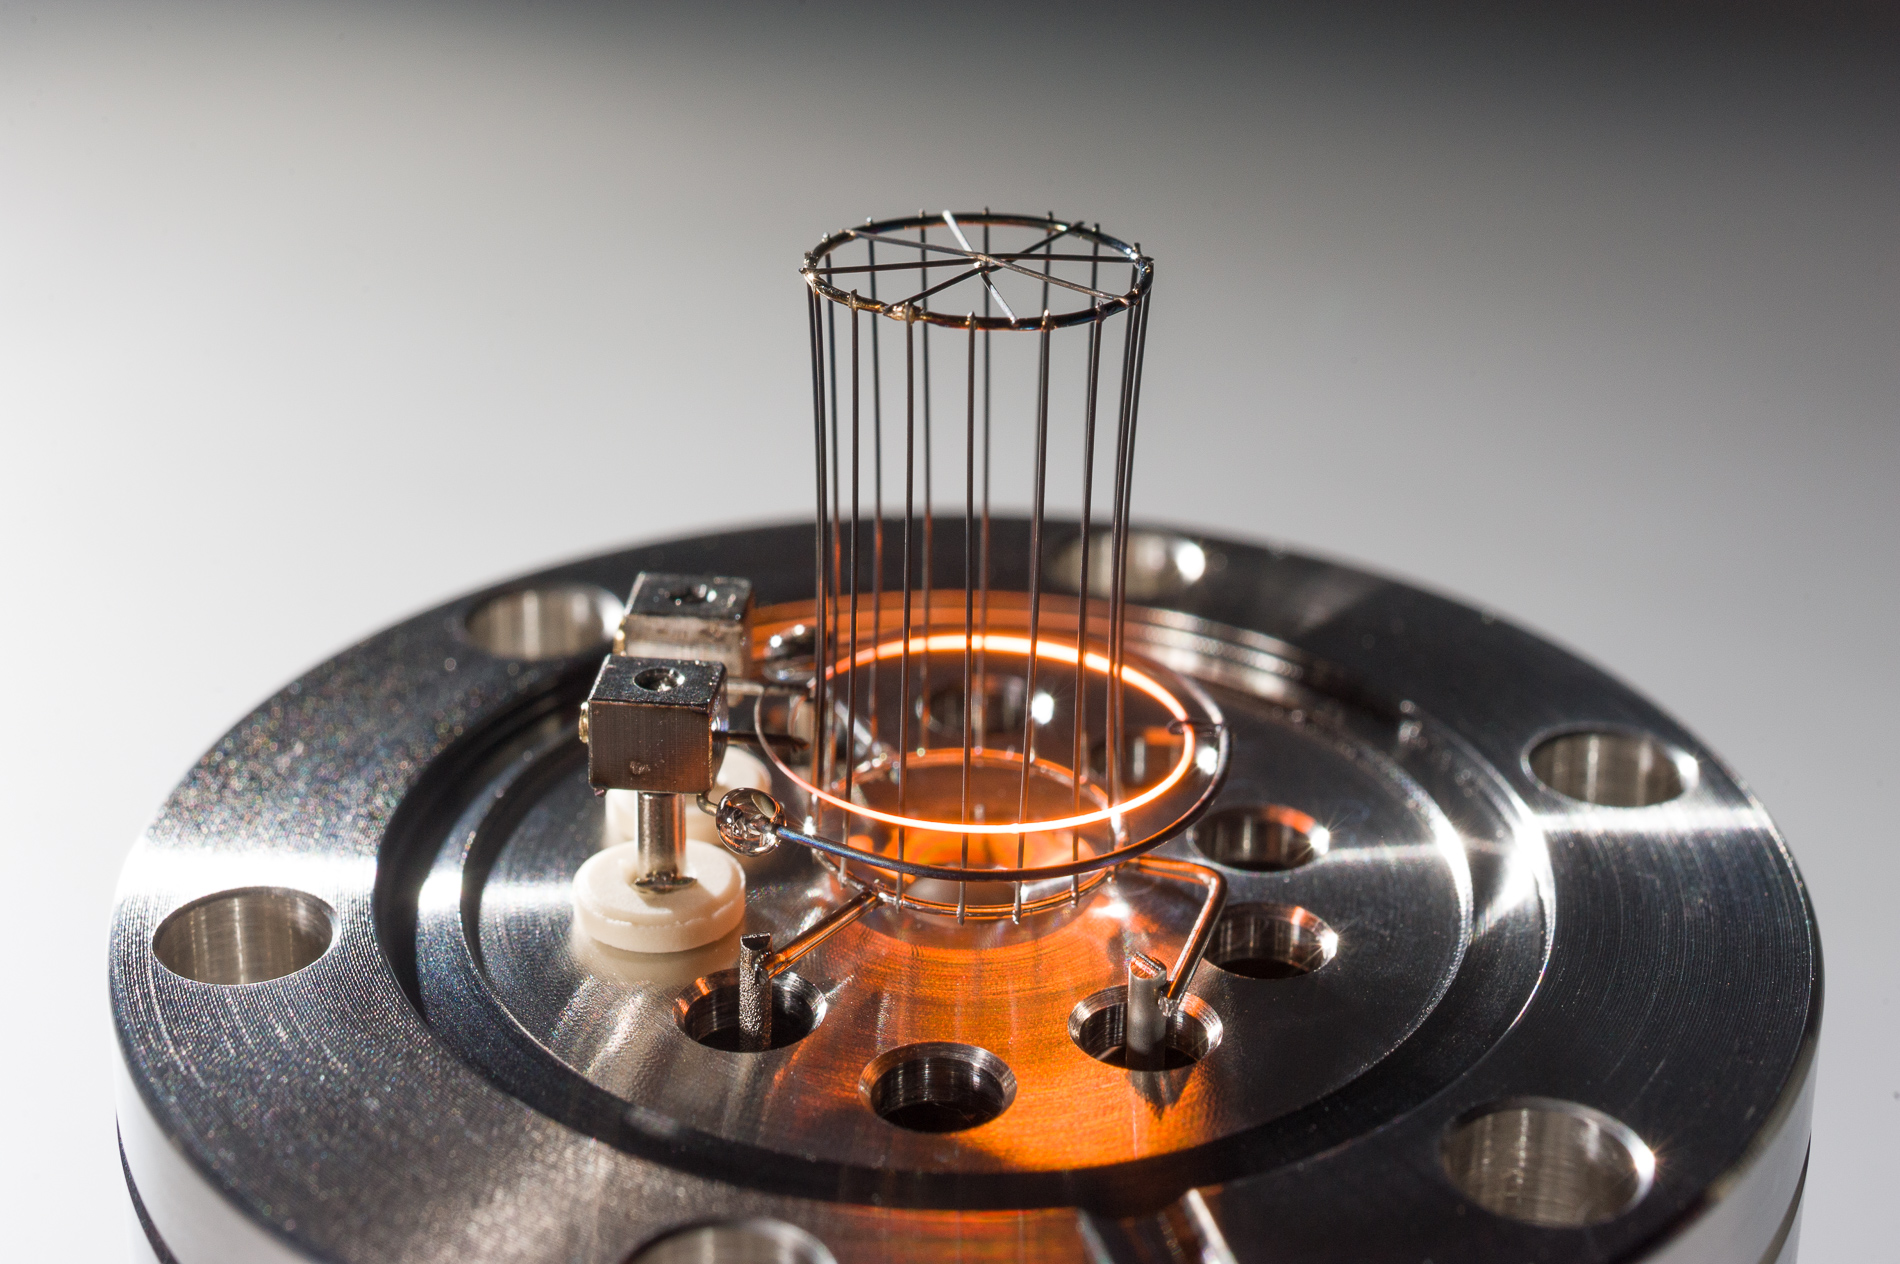
These potential discrepancies are why the device pictured in Figure 1 is so important. The Ion Reference Gauge 080 (IRG080), produced by INFICON, is the result of a multinational project to develop a better tool for quantifying pressure in HV/UHV environments.
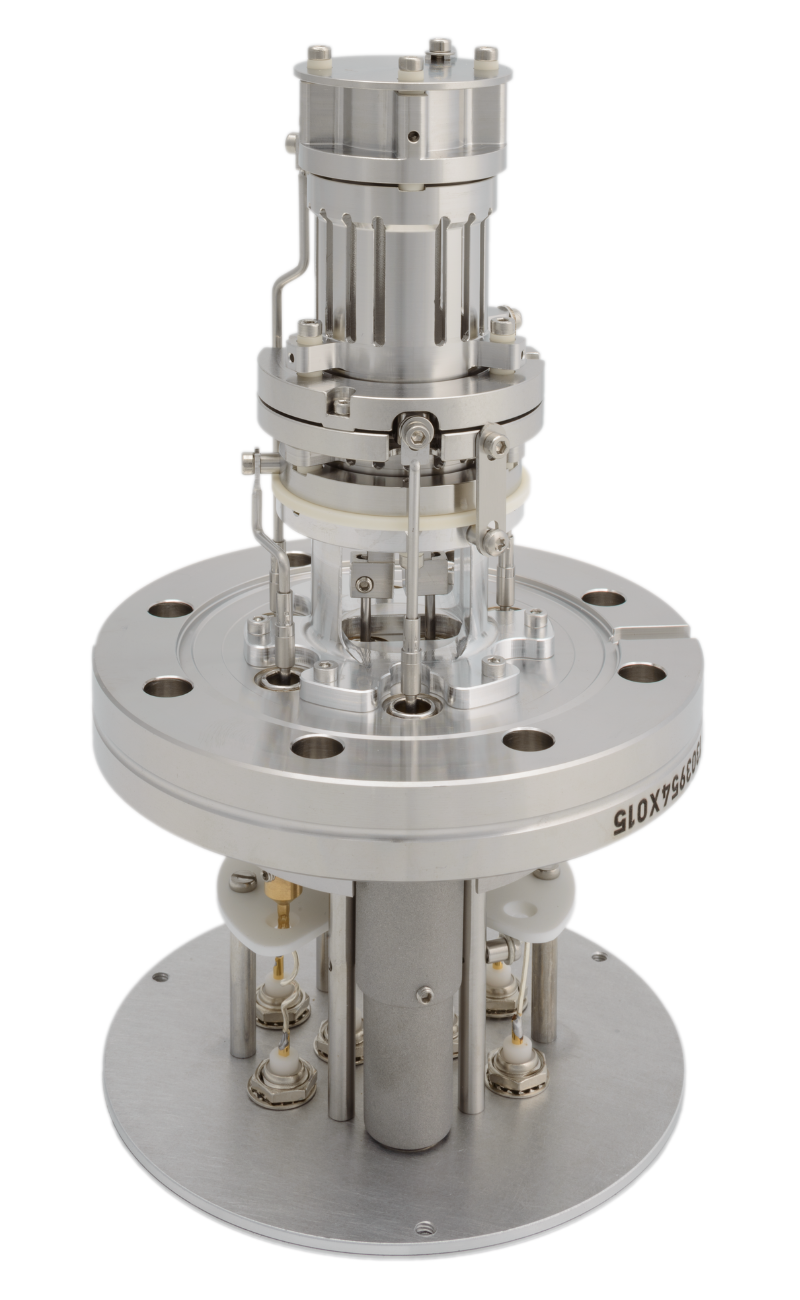
The development of this sensor, which is more precise, robust, and reproducible than existing ionization gauges, was coordinated by the European Metrology Programme for Innovation and Research (EMPIR) (Ref. 1). EMPIR is a collaborative effort by private companies and government research organizations to help make Europe's "research and innovation system more competitive on a global scale" (Ref. 2). The project participants considered multiple options before agreeing that INFICON's design best fulfilled the performance goals.
Organizations who participated in the ionization gauge project include (Ref. 3):
- Physikalisch-Technische Bundesanstalt (PTB) — Germany
- Cesky Metrologicky Institut Brno (CMI) — Czech Republic
- Institut za Kovinske Materiale in Tehnologije (IMT) — Slovenia
- Laboratoire national de métrologie et d'essais (LNE) — France
- Research Institutes of Sweden AB (RISE) —Sweden
- European Organization for Nuclear Research (CERN) — Europe
- Faculdade de Ciências e Tecnologia Universidade Nova de Lisboa (FCT-UNL) — Portugal
- VACOM Vakuum Komponenten & Messtechnik GmbH — Germany
- INFICON Aktiengesellschaft — Liechtenstein
VACOM and INFICON are the two instrument manufacturers who designed and built gauge prototypes.
Determining Gas Density Through Ionization
"Nothing happens in a vacuum" is a familiar expression, but many useful things actually do come from nearly-empty spaces. "There are almost no high-tech products that do not involve a vacuum process," says Martin Wüest, head of sensor technology at INFICON.
The term "vacuum" can describe a theoretical absolute of absence, but as indicated by HV/UHV terminology, the emptiness of an actual space is usually a matter of degree. Measuring different degrees of vacuum calls for various methods for determining pressure levels. "Depending on conditions, certain means of measuring pressure work better than others," says Wüest. "At near-atmospheric pressures, you can use a capacitive diaphragm gauge. At middle vacuum, you can measure heat transfer occurring via convection." Neither of these approaches is effective at HV (defined as pressure below 0.1 pascals, or Pa) or UHV (below 10-6 Pa) pressure levels.
"At HV/UHV pressures, there are not enough particles to force a diaphragm to move, nor are we able to reliably measure heat transfer. This is where we use ionization to determine gas density and corresponding pressure," Wüest explains.
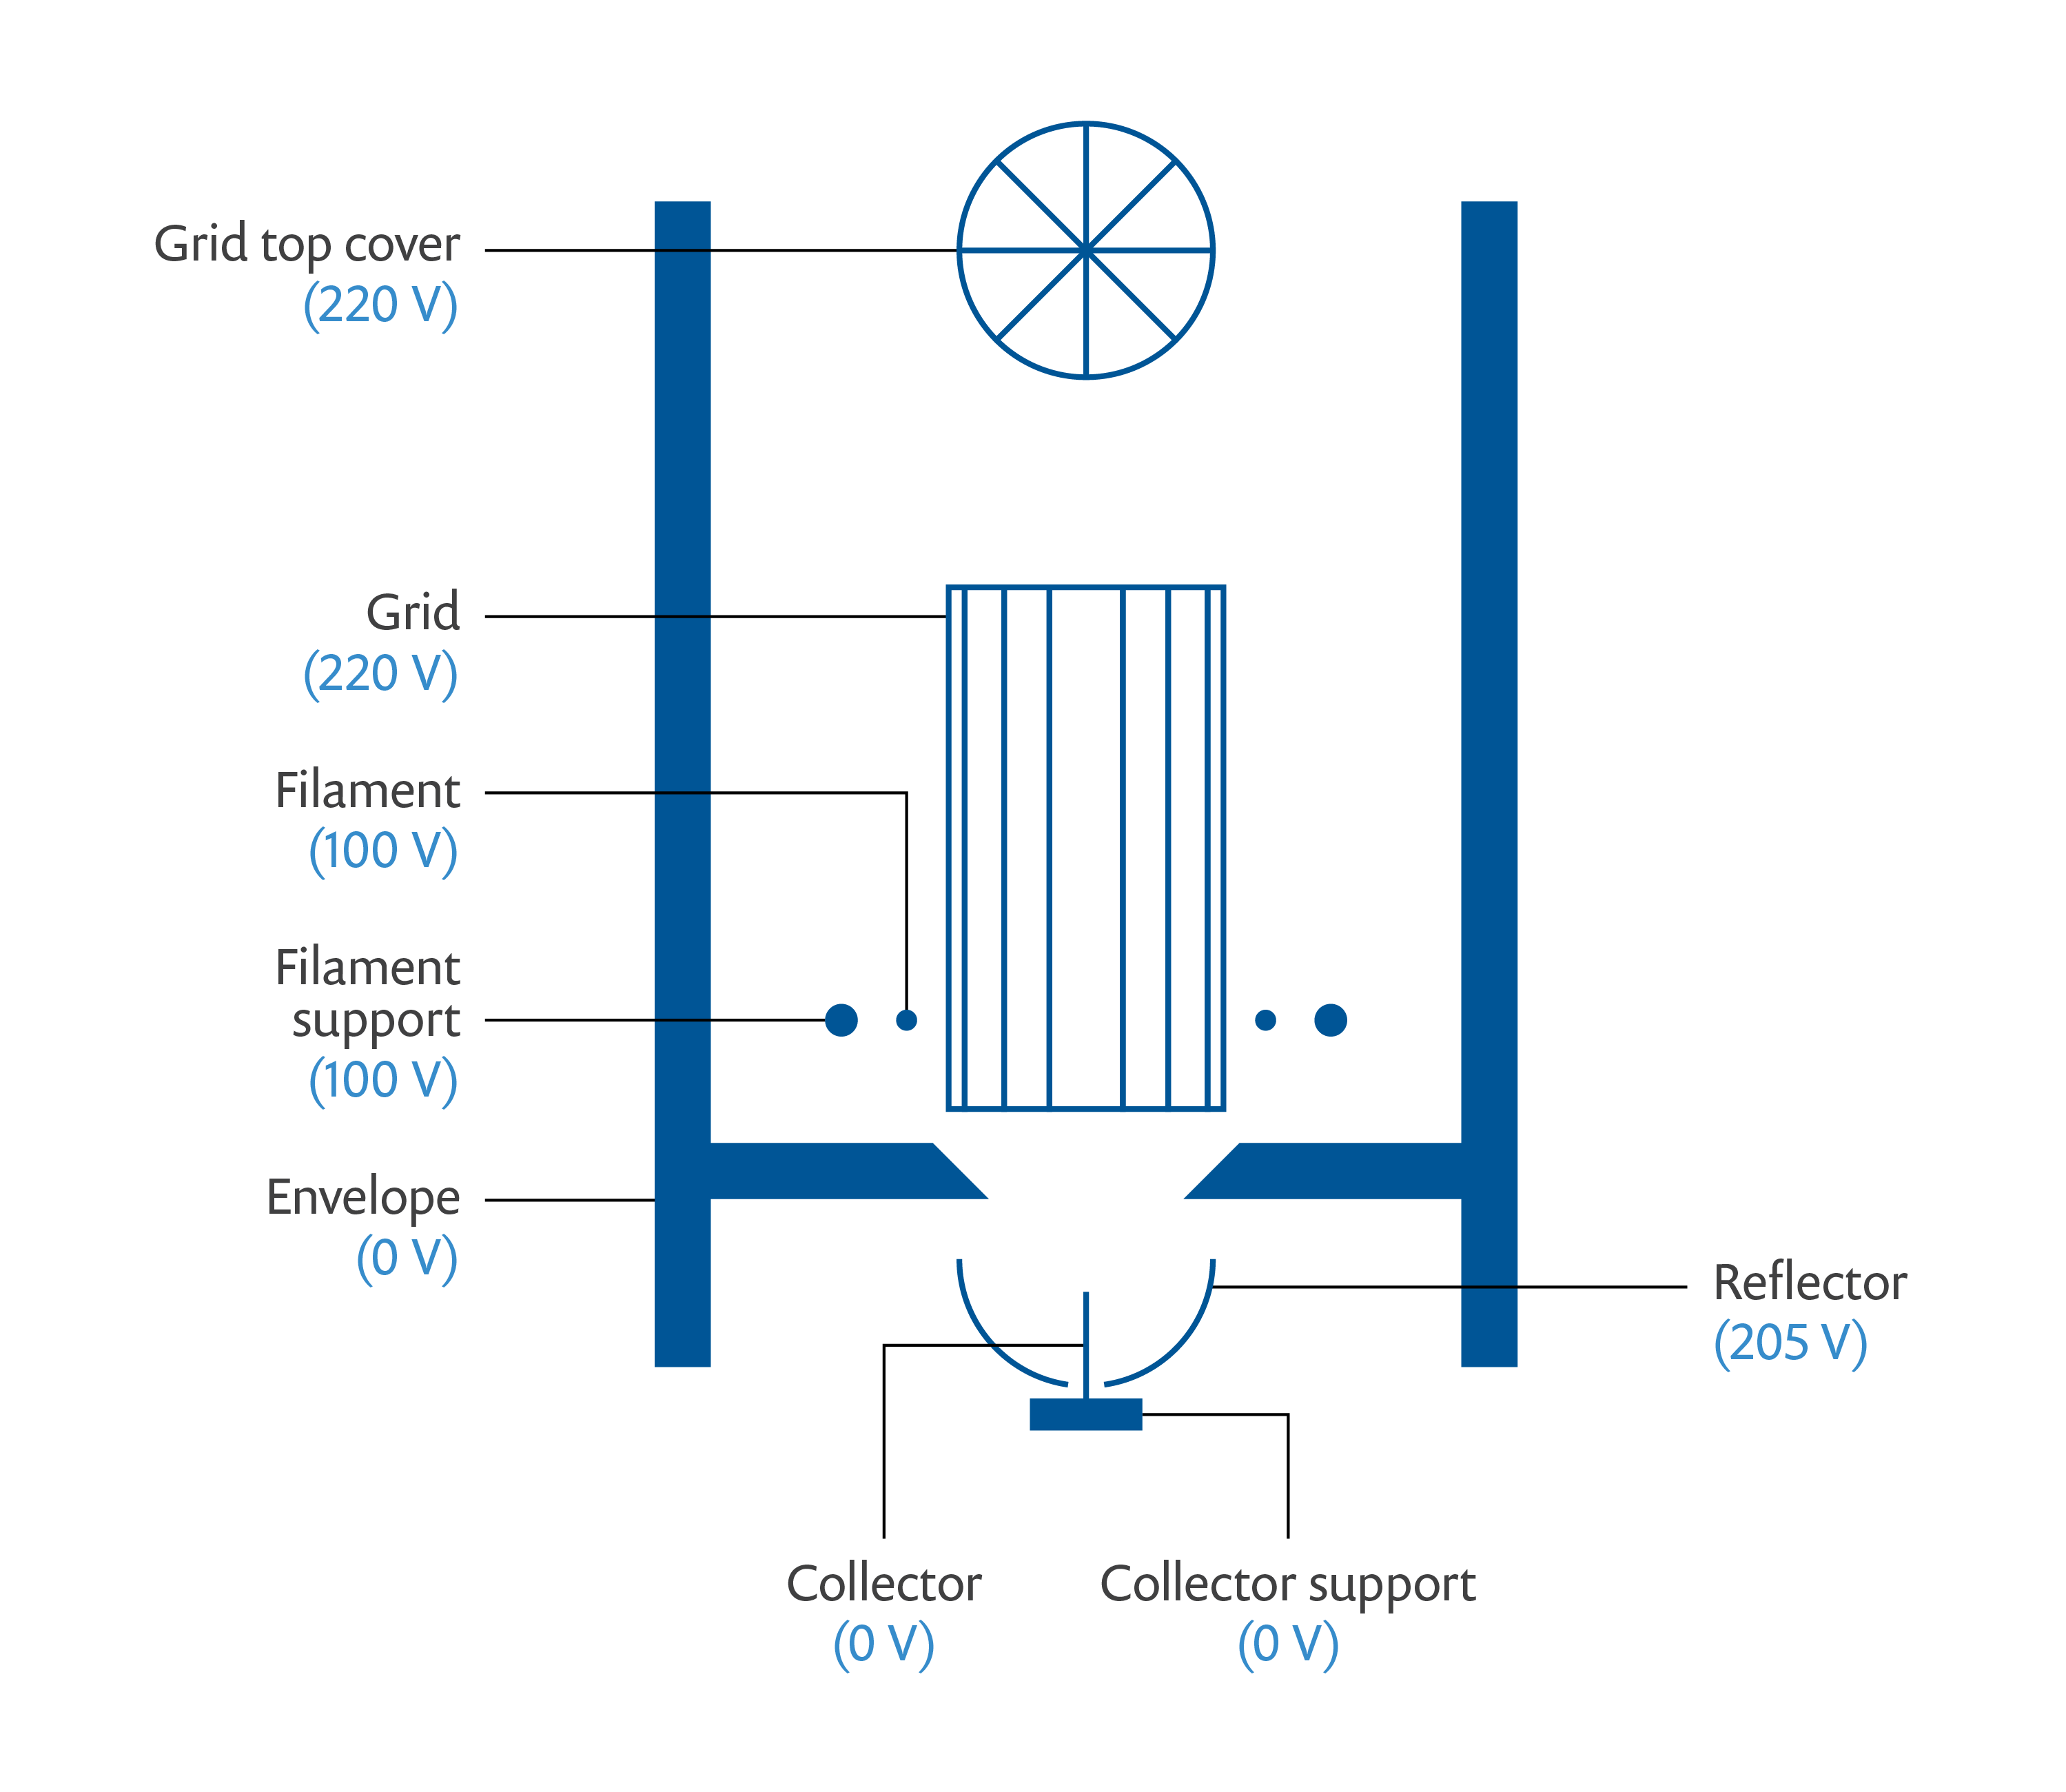
The most commonly used HV/UHV pressure-measuring tool is a Bayard–Alpert hot-filament ionization gauge (Figure 2), which is placed inside the vacuum chamber. The heart of this instrument consists of three components: the filament (or hot cathode), the grid, and the ion collector. Its operation starts with supplying low-voltage electric current to the filament, causing it to heat up. As the filament becomes hotter, it emits electrons that are attracted to the grid, which is supplied with higher voltage. Some of the electrons flowing toward and within the grid will collide with any free-floating gas molecules that are circulating in the vacuum chamber. Electrons that collide with gas molecules will form ions that then flow toward the collector. This measurable ion current in the collector will be proportional to the density of gas molecules in the chamber.
"We can then convert density to pressure, according to the ideal gas law," Wüest said. "Pressure will be proportional to the ion current divided by the electron current, divided by a sensitivity factor that is adjusted depending on what gas is in the chamber."
Existing Gauges Are Sensitive to Heat and Rough Handling
What makes a good tool? Picture a carpenter at work, with hammer, saw, and measuring tape close at hand. Each of these instruments may have scars from hard use, but a few dents and dings do not keep such tools from doing their jobs. Unfortunately, the same thing cannot be said about Bayard–Alpert ionization gauges. While the operational principles of these devices are sound, their calibration is too easily compromised by routine use and handling.
"A typical ionization gauge contains fine metal structures that are held in spring-loaded tension," says Wüest. "Each time you use the device, you heat the filament to between 1200 and 2000°C. That affects the metal in the spring and can distort the shape of the filament. This changes the starting location of the electron flow and the paths the electrons follow."
Along with their sensitivity to heat, the core components of a Bayard–Alpert gauge can become easily misaligned. This can introduce measurement uncertainty of 10 to 20% — an unacceptably wide range of variation. "Most vacuum chamber systems are overbuilt as a result," Wüest says, and the need for frequent gauge recalibration also wastes precious development time and money.
Building a Simulation Model of a Benchmark Design
The project team set a measurement uncertainty target of 1% or less for when the gauge is used to detect nitrogen gas. Another important goal was to eliminate the need to recalibrate gas sensitivity factors for each gauge and gas species being detected. The new design's performance needed to be unaffected by minor shocks and reproducible by multiple manufacturers.
To achieve these ambitious goals, the project team first dedicated itself to studying HV/UHV measurement. Its research encompassed a broad review of 260 relevant studies. After completing their review, the project partners selected one design that incorporates current best practice for ionization gauge design: INFICON's IE514 extractor-type gauge.
NOVA University Lisbon in Portugal, the European research lab CERN, and INFICON each developed simulation models of the IE514 design (Figure 3). The results generated by each model were compared to test results from a physical prototype of the IE514 gauge to ensure the models' accuracy before proceeding with new designs.
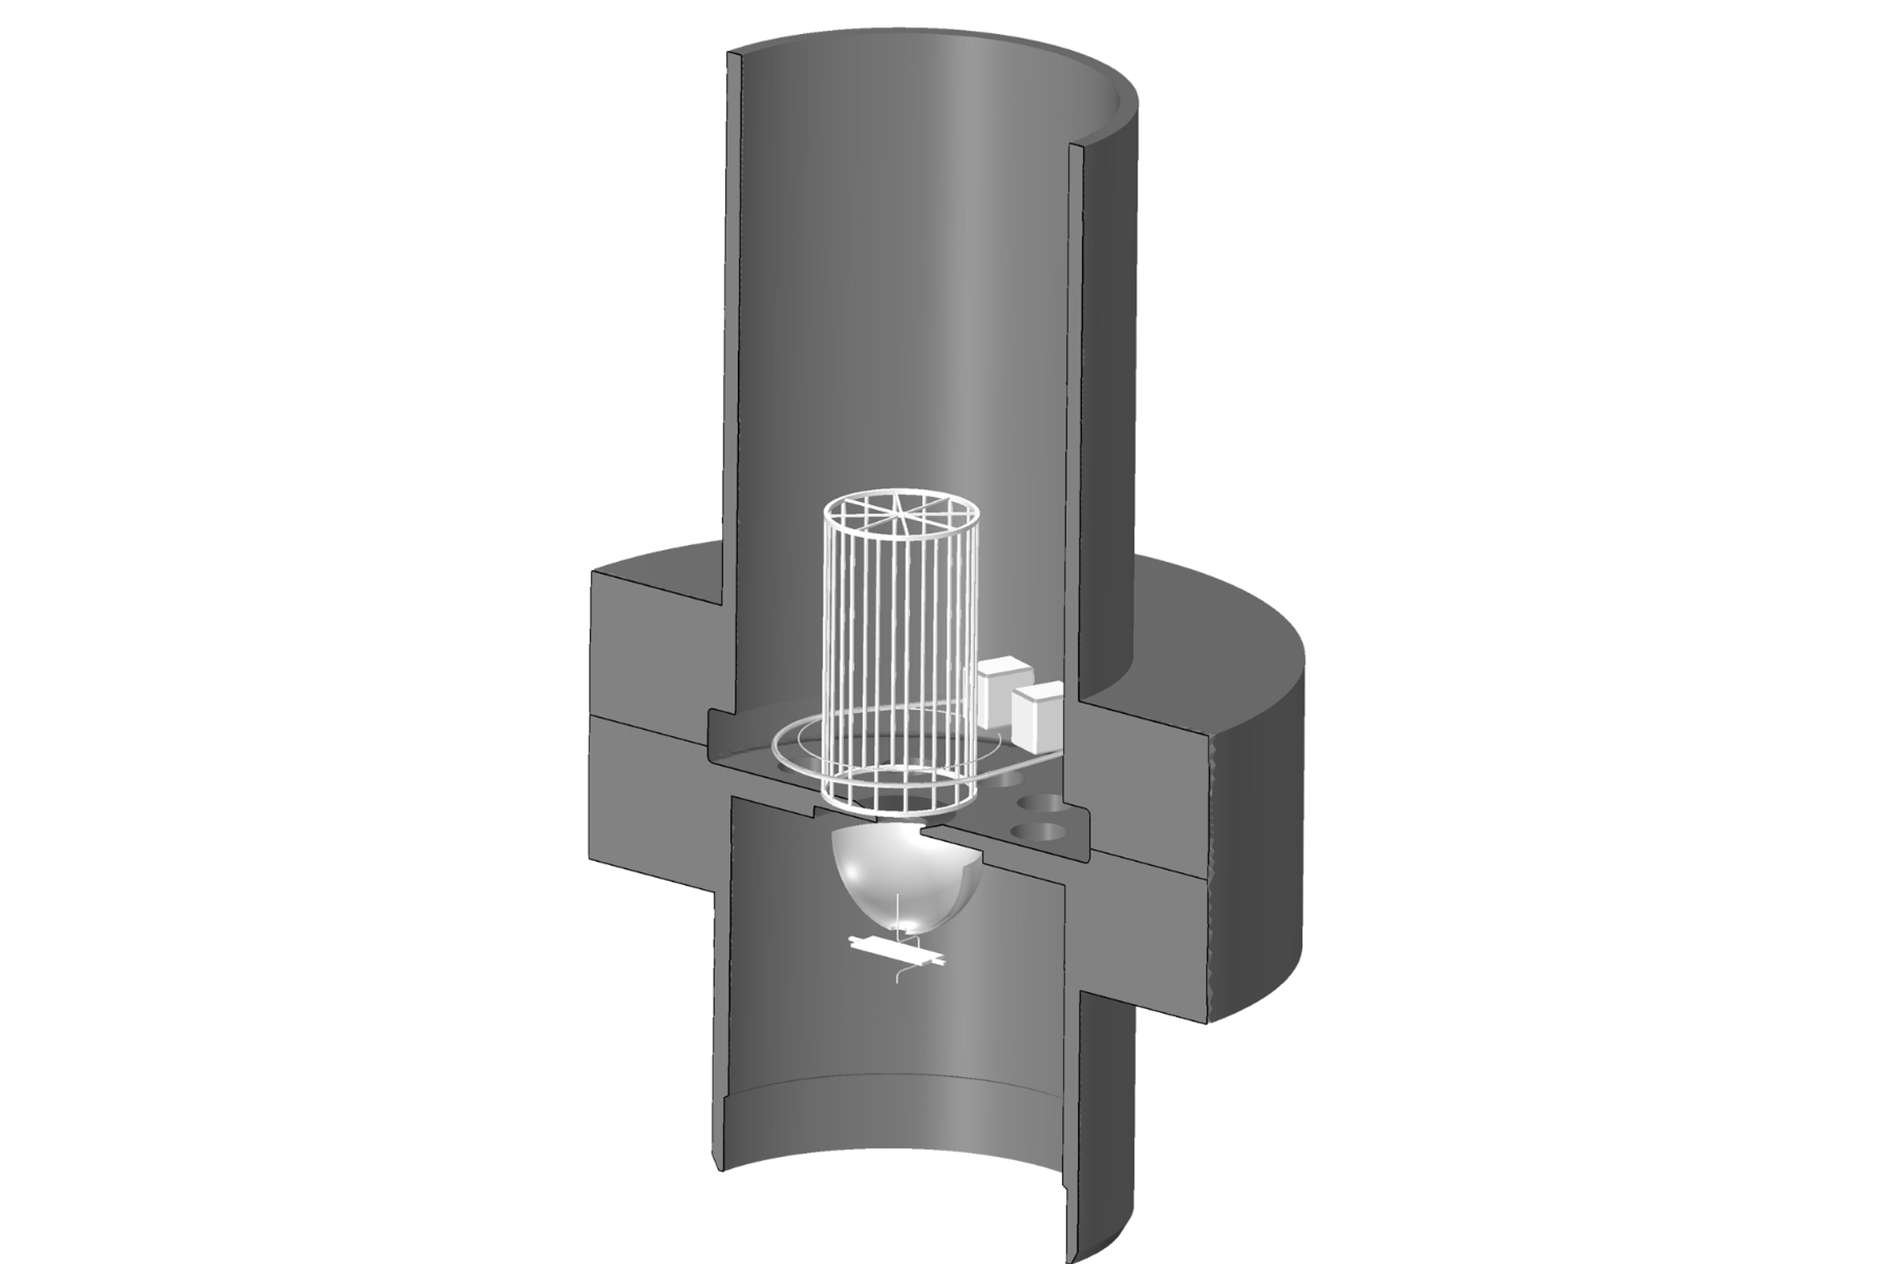
Francesco Scuderi, an INFICON engineer who specializes in simulation, used the COMSOL Multiphysics® software to model the IE514 (Figure 4). The model enabled analysis of thermionic electron emissions from the filament and the ionization of gas by those electrons. The model can also be used for ray tracing the paths of generated ions toward the collector. With these simulated outputs, Scuderi could calculate an expected sensitivity factor, which is based on how many ions are detected per emitted electron — a useful metric for comparing the overall fidelity of the model with actual test results.
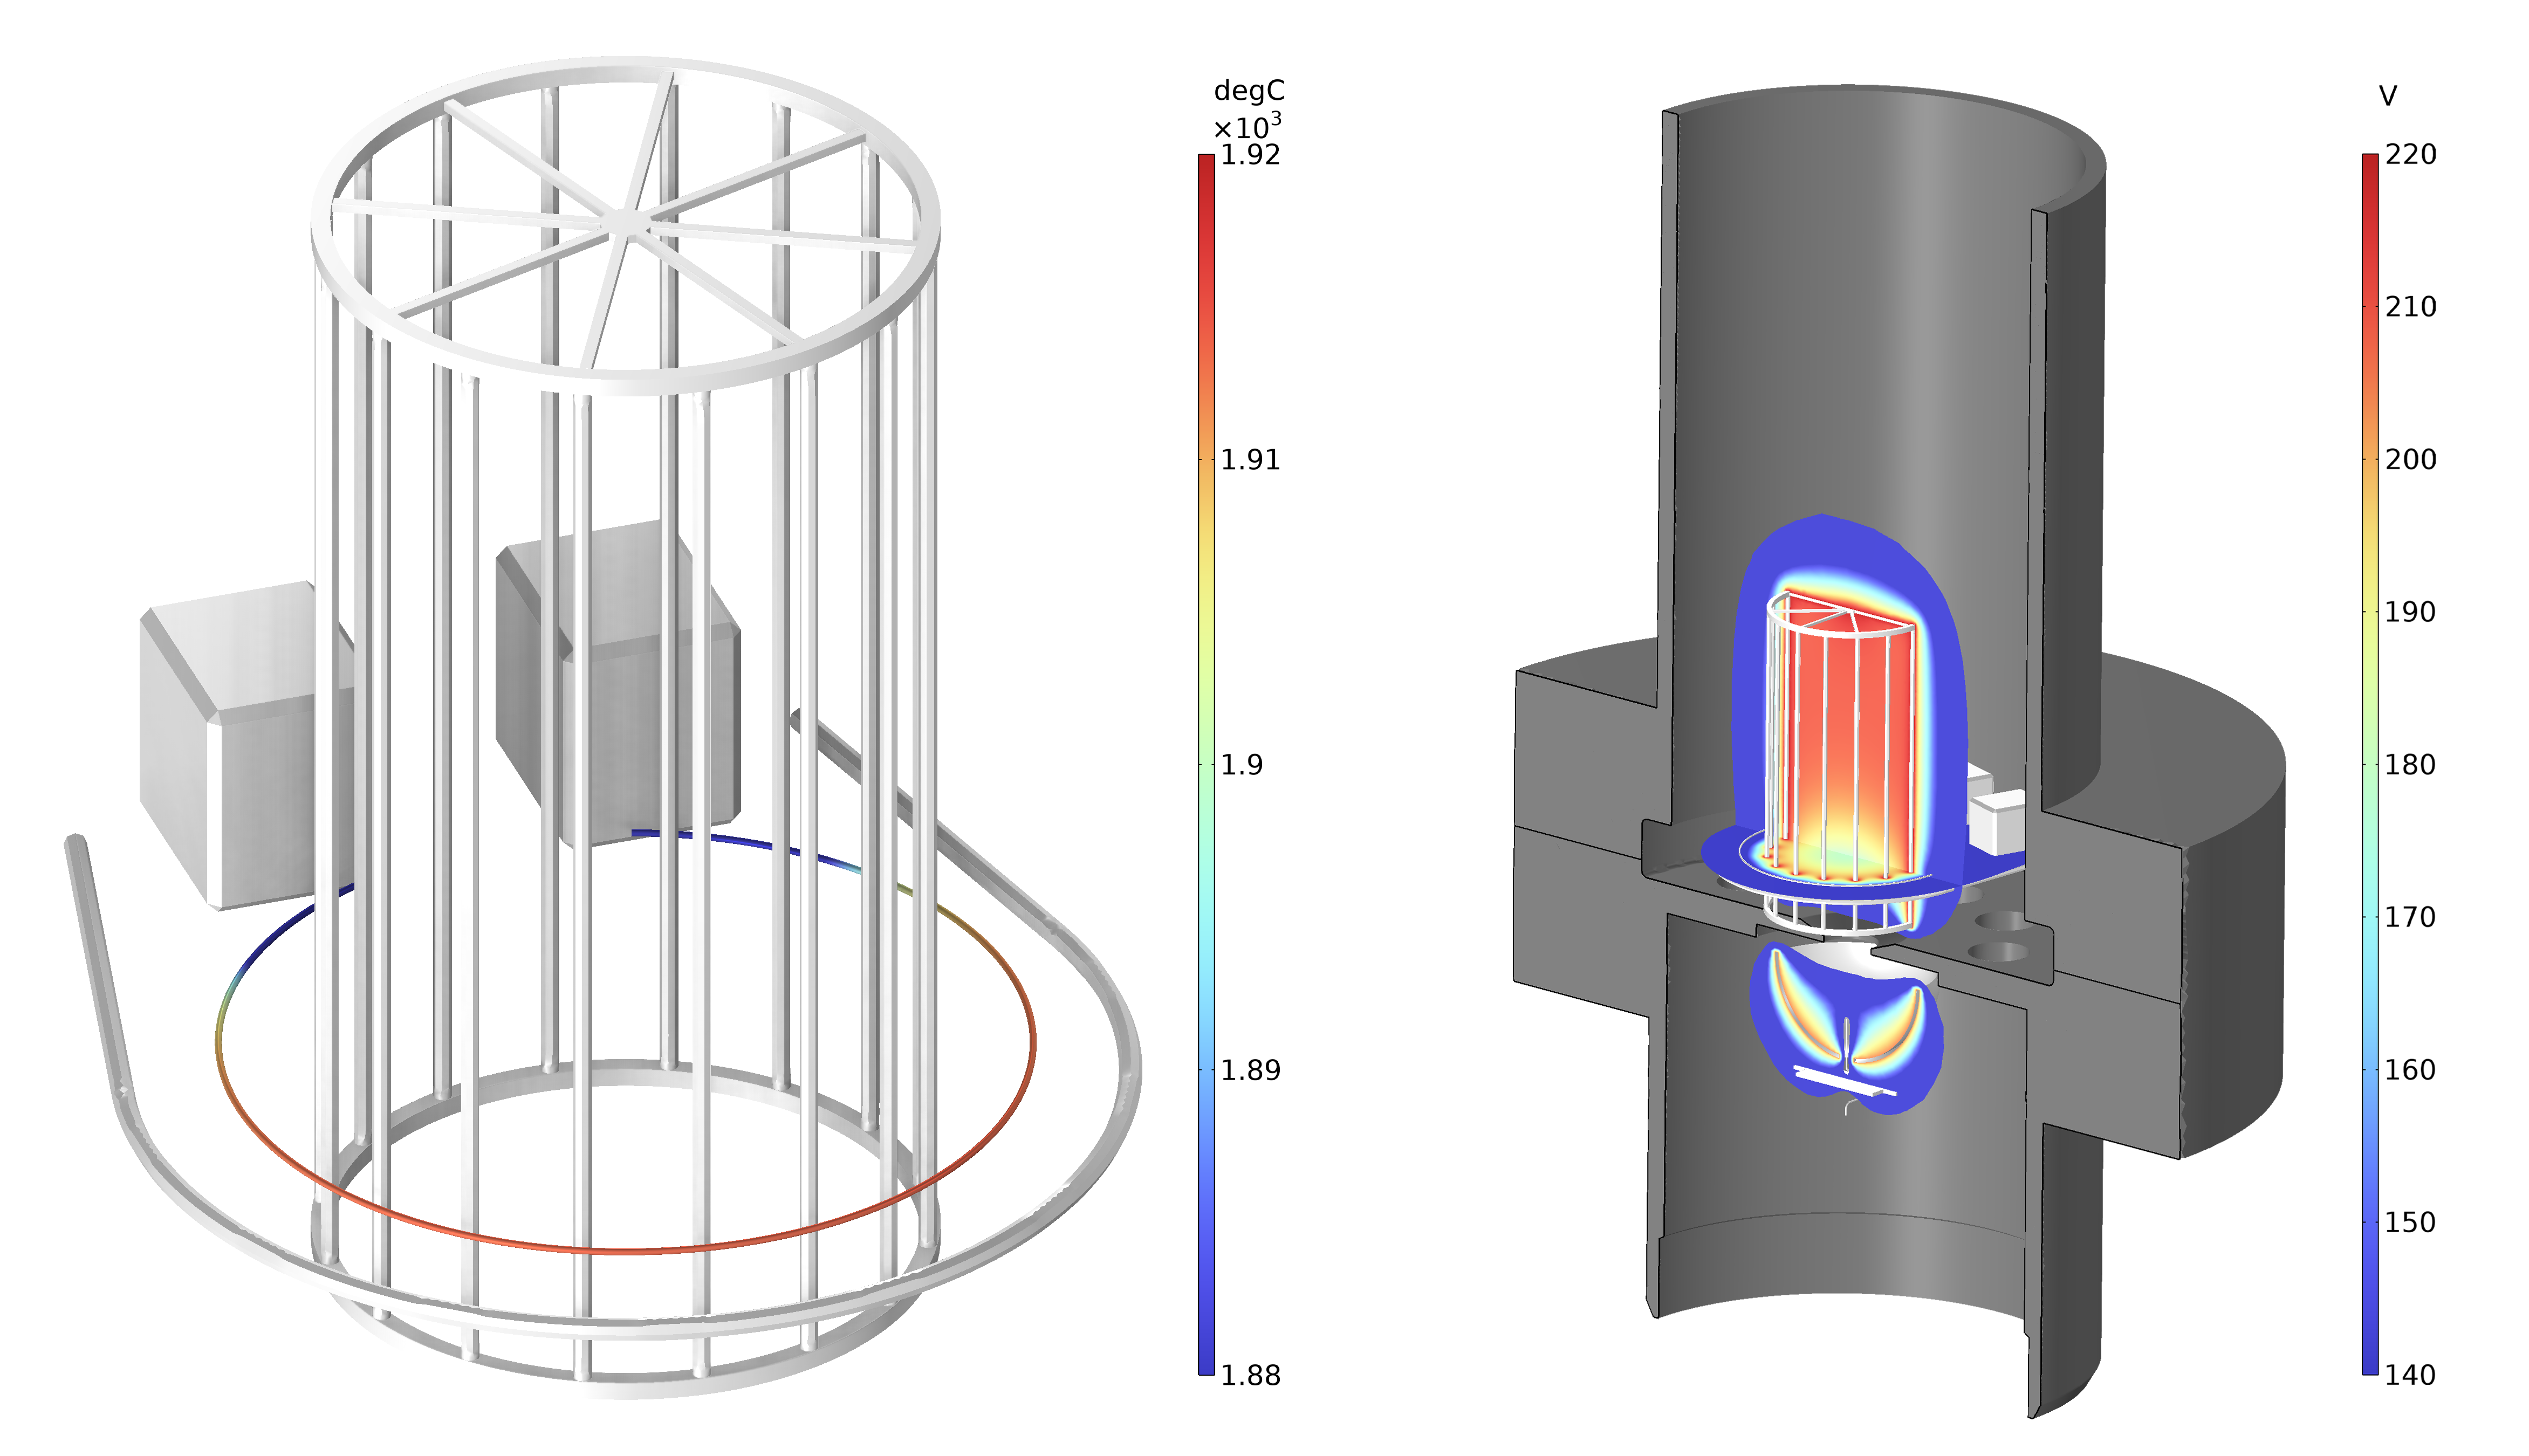
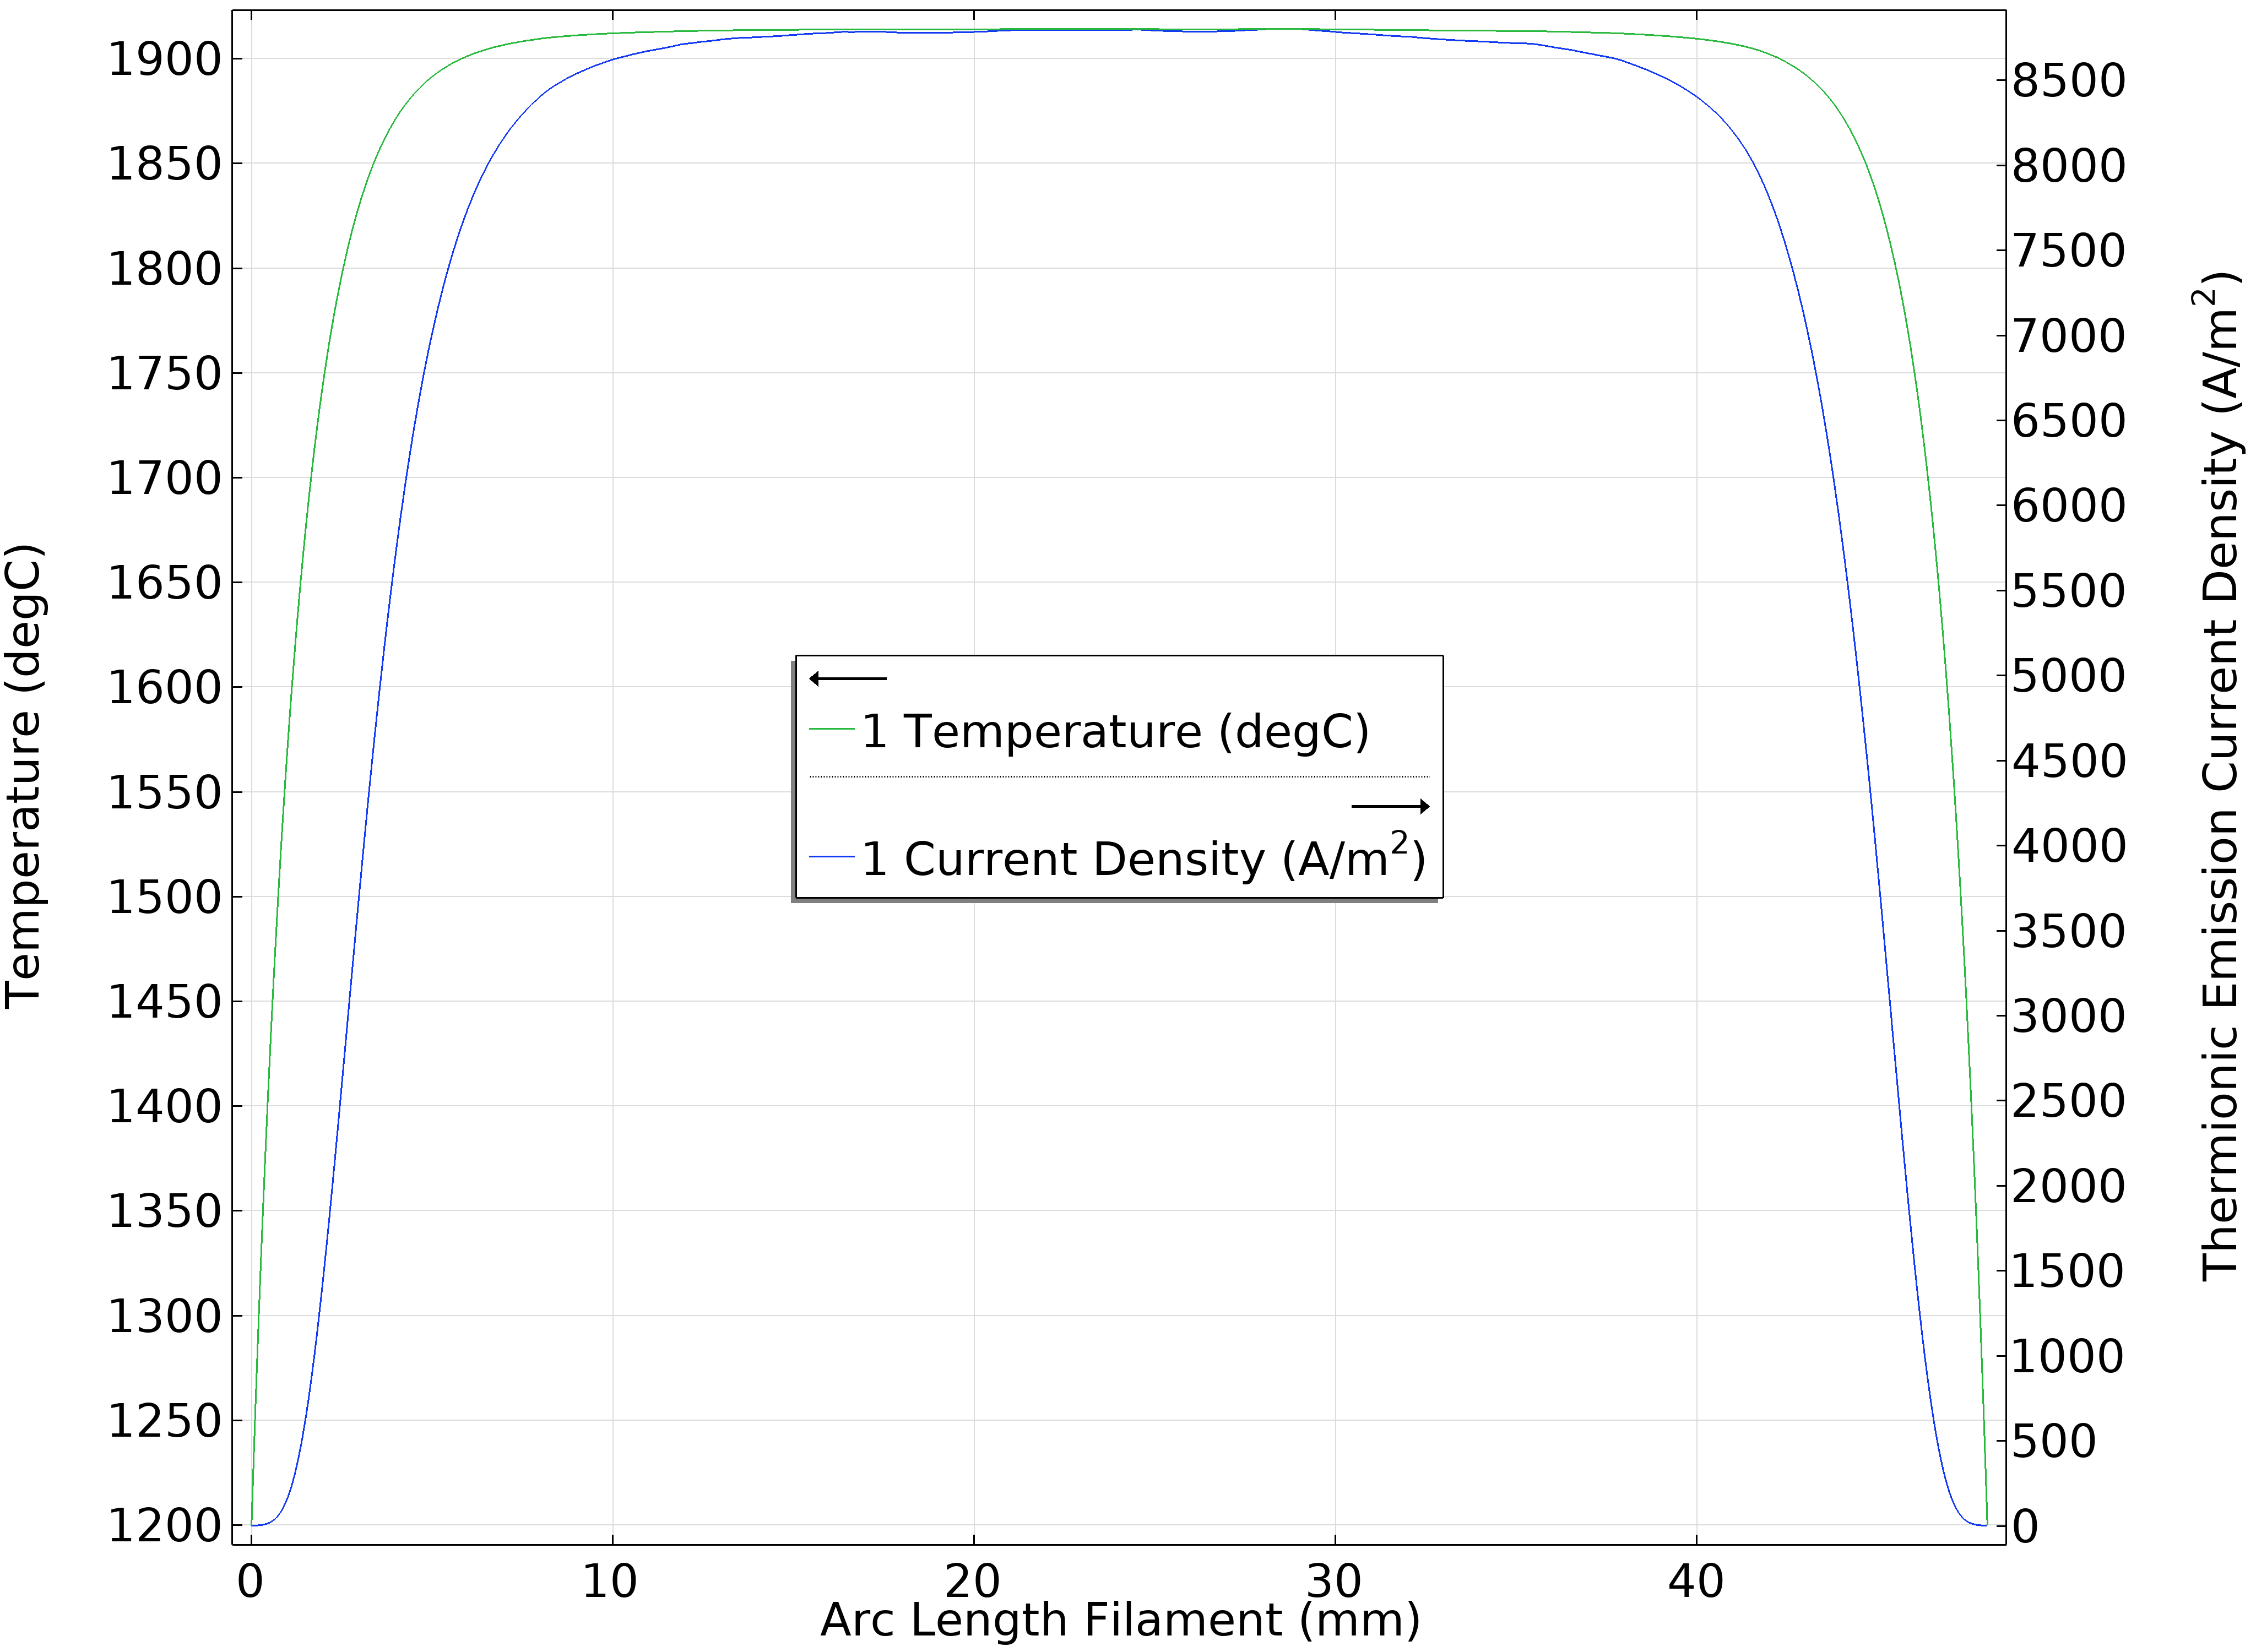
"After constructing the model geometry and mesh, we set boundary conditions for our simulation," Scuderi explains. "We are looking to express the coupled relationship of electron emissions and filament temperature, which will vary from approximately 1400 to 2000°C across the length of the filament. This variation thermionically affects the distribution of electrons and the paths they will follow." (Figures 5–6)
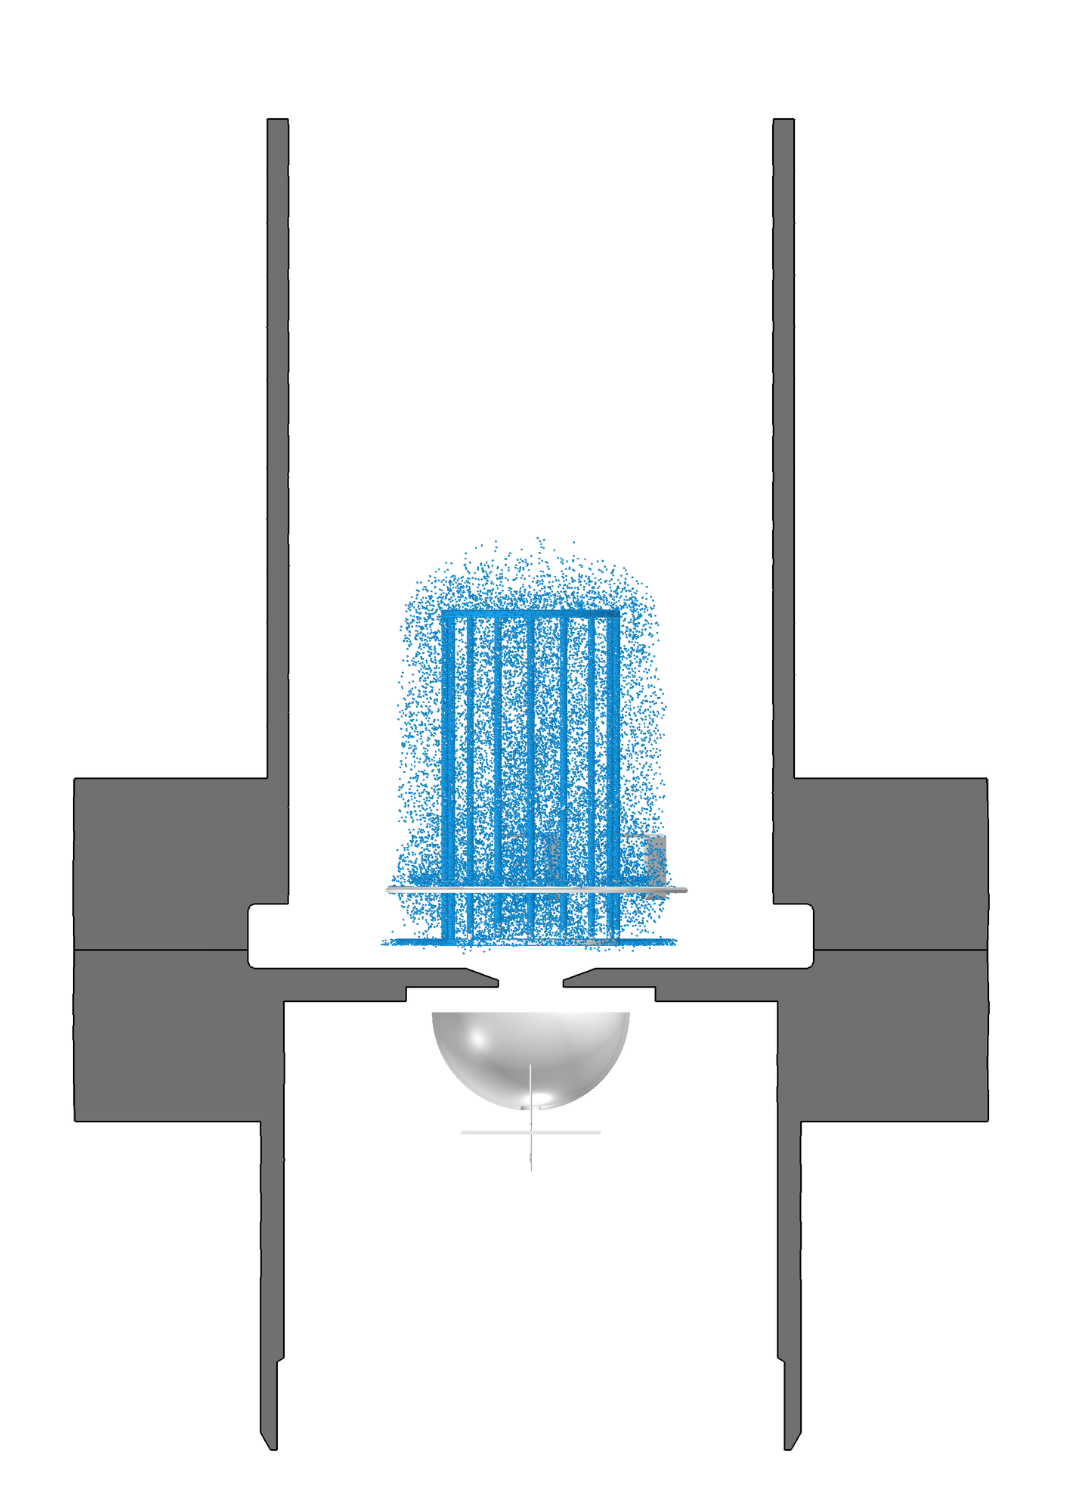
"Once we simulate thermal conditions and the electric field, we can begin our ray tracing simulation," Scuderi continues. "The software enables us to trace the flow of electrons to the grid and the resulting coupled heating effects." Next, the model is used to calculate the percentage of electrons that collide with gas particles. From there, ray tracing of the resulting ions can be performed, tracing their paths toward the collector, as shown in Figure 7.
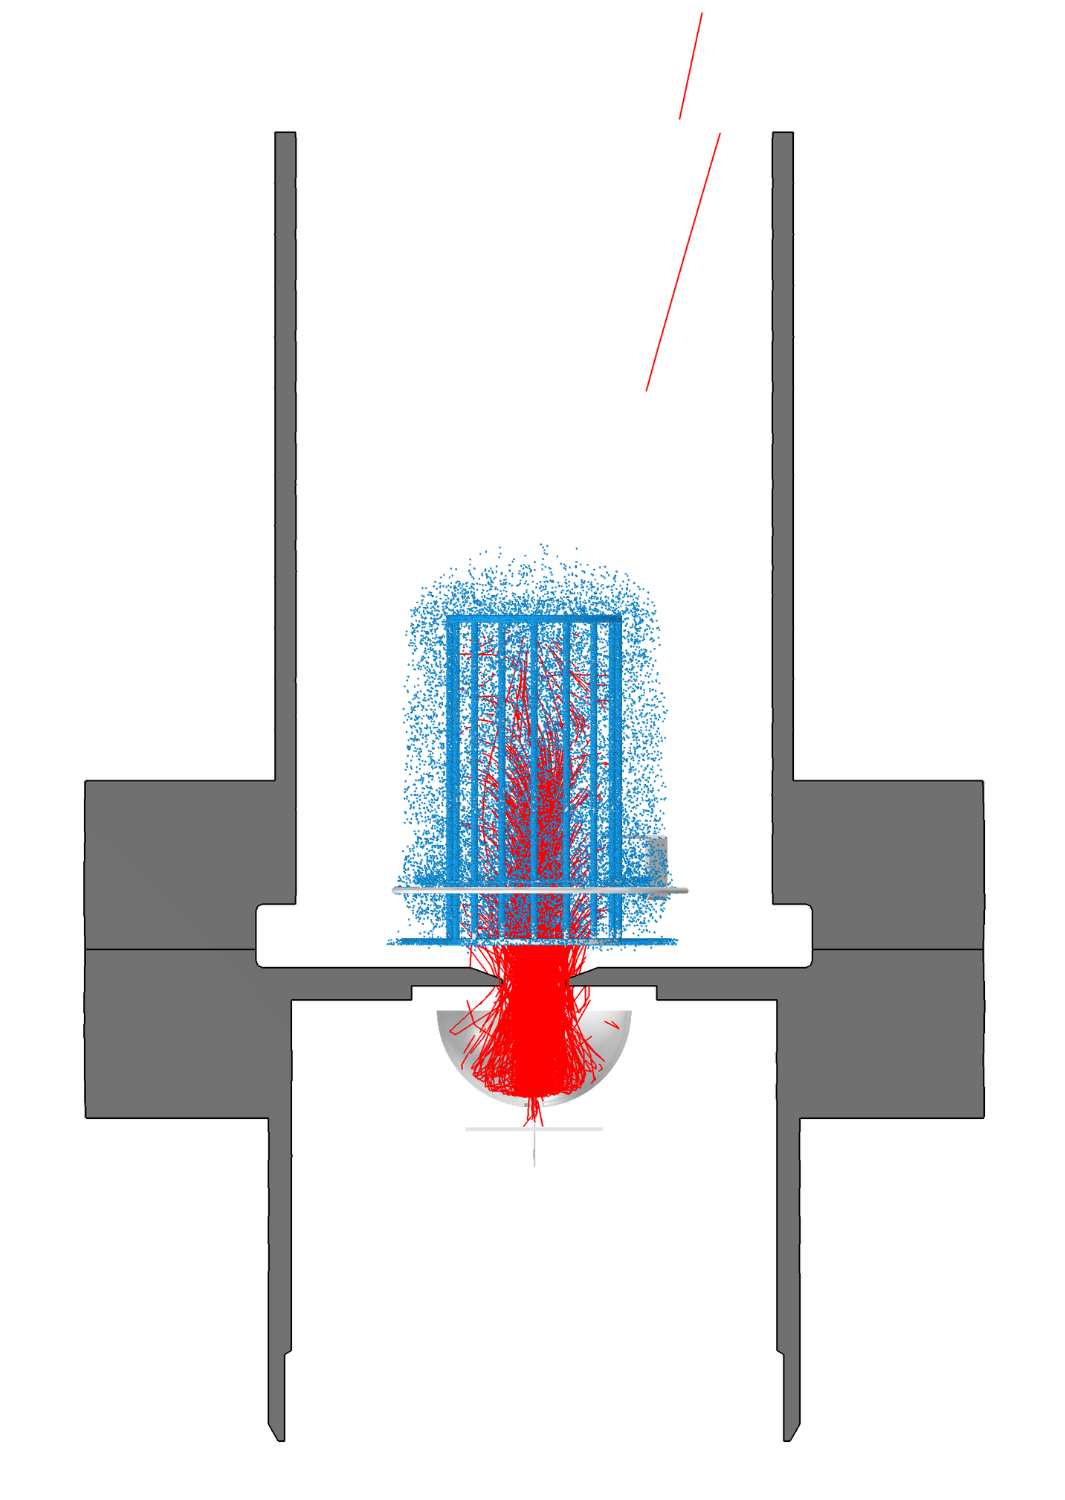
"We can then compare the quantity of circulating electrons with the number of ions and their positions. From this, we can extrapolate a value for ion current in the collector and then compute the sensitivity factor," says Scuderi.
INFICON's model did an impressive job of generating simulated values that closely aligned with test results from the benchmark prototype. This enabled the team to observe how changes to the modeled design affected key metrics, including ionization energy, the paths of electrons and ions, emission and transmission current, and sensitivity.
Simulation Led to a More Precise, Robust, and Reproducible Gauge
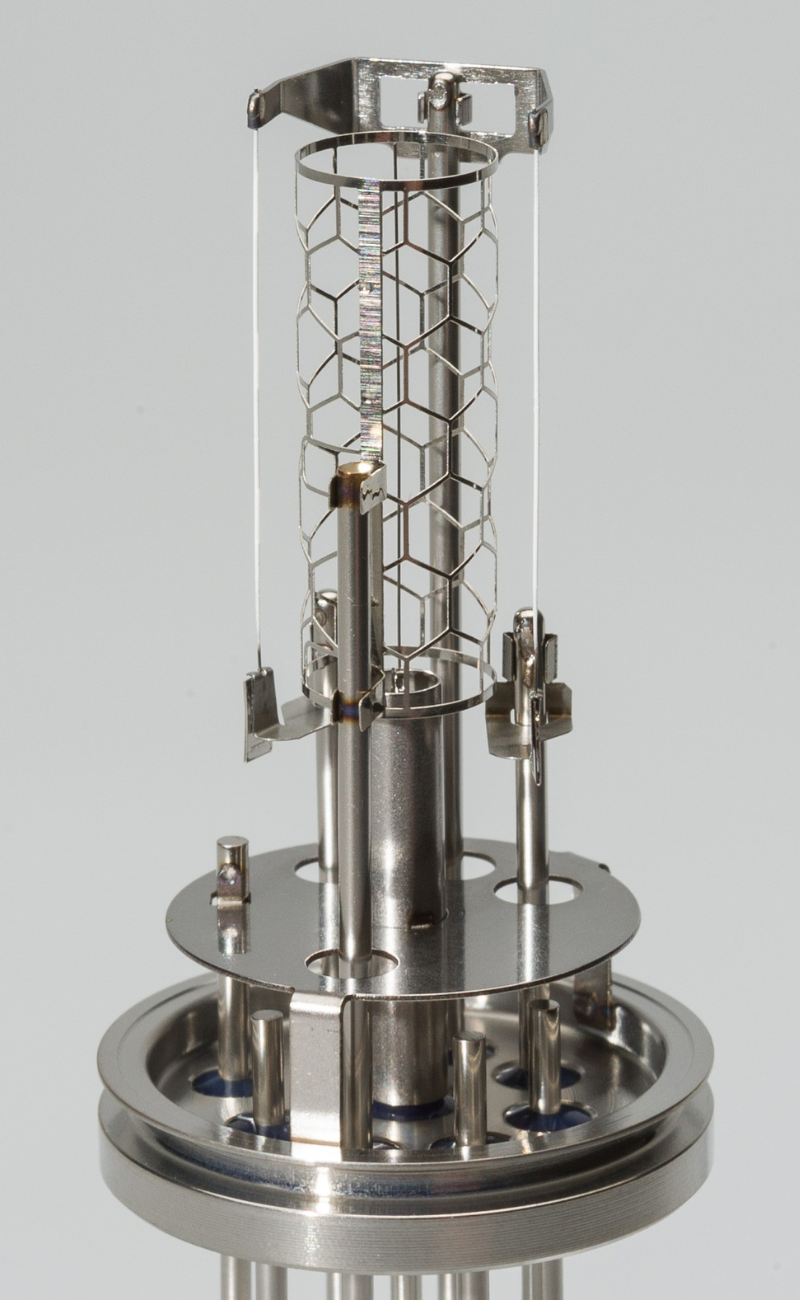
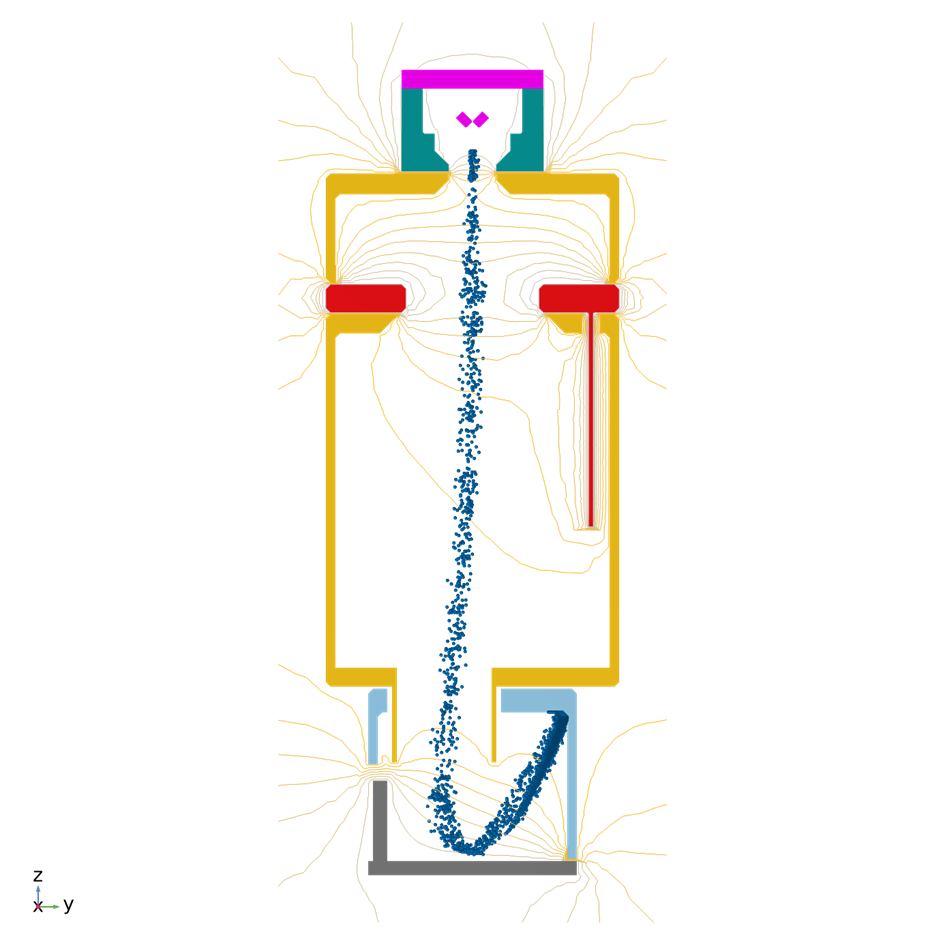
The end product of INFICON's design process, the IRG080, incorporates many of the same components as existing Bayard–Alpert gauges, but key parts look quite different. For example, the new design's filament is a solid suspended disc, not a thin wire. The grid is no longer a delicate wire cage but is instead made from stronger formed metal parts. The collector now consists of two components: a single pin or rod that attracts ions and a solid metal ring that actually helps direct electron flow away from the collector and toward a Faraday cup. This arrangement, refined through ray tracing simulation with the COMSOL Multiphysics® software, improves accuracy by better separating the paths of ions and electrons.
INFICON built 13 prototypes that underwent evaluation by the project consortium. Testing showed that the IRG080 achieved the goal of reducing measurement uncertainty to below 1%. In regard to sensitivity, the IRG080 performed eight times better than the benchmark. Just as importantly, the INFICON prototype yielded consistent results during multiple testing sessions, delivering sensitivity repeatability performance that was 13 times better than that of the benchmark gauge. Twenty-three identical gauges were built and tested during the project, confirming that INFICON had created a more precise, robust, and reproducible tool for measuring HV/UHV conditions.
At the completion of the ion gauge project, the INFICON team hoisted an impressive trophy: the IRG080 itself. Martin Wüest said, modestly, "We consider it a good demonstration of our capabilities."
Of course, this success was not the team's alone. INFICON benefited from its partners' insights and support; in turn, the broader scientific and manufacturing community will benefit from more consistent measurements of HV/UHV conditions. The entire project is a welcome example of a contest where, in the end, everyone wins.
References
- Euramet, "Towards a Documentary Standard for an Ionisation Vacuum Gauge," Feb. 2021; https://www.euramet.org/project-16NRM05
- Euramet, "About EMPIR," 2023; https://www.euramet.org/research-innovation/research-empir/about-empir
- EMPIR, "Ion Gauge: Members of the Project," May 2019; https://www.ptb.de/empir/16nrm05-consortium.html